Python3 + NumPy, SciPy, Matplotlib
Python3
でグラフ描画や科学技術計算などの機能を利用することを目的に、Python 3.4.1 インストール後、NumPy, SciPy,
Matplotlib
をインストールした。その際、実際に機能を利用するに至るまで、いくつかの困難を乗り越える必要があった。具体的には、Python 3.4.1 をインストール済みの Windows
8.1 上で NumPy, SciPy, Matplotlib をインストール後、末尾のようなグラフプロットのプログラムリストを作成して Run
した所、3度の ImportError
が出た。この Error に対して、以下のようなインストール作業をしていった所、プログラム実行できるようになった。ここに、参考のために顛末をメモしておく。
なお、使用した NumPy, SciPy, Matplotlib
のインストーラは以下の通りである。
※ http://sourceforge.net/projects/numpy/files/
scipy-0.14.0-win32-superpack-python3.4.exe
※ http://sourceforge.net/projects/numpy/files/
matplotlib-1.4.0.win32-py3.4.exe
※ http://matplotlib.org/downloads.html
1.
ImportError
で要求されたモジュール
【1度目】 ”ImportError: No module named 'six'”
2.pip のインストール
pip とは、”Python で書かれたパッケージソフトウェアをインストール・管理するためのパッケージ管理システム”である。Six
等のパッケージをインストールするために pip が必要とのこと。
get-pip.py をダウンロードしたフォルダーのコマンドプロンプト(アドレスバーに "cmd" )から、
”python get-pip.py”
で、pip をインストール完了。
※ https://pip.pypa.io/en/latest/installing.html
3.Six のインストール
Six とは、”Six provides simple utilities for wrapping over differences
between Python 2 and Python 3” である
six-1.8.0-py2.py3-none-any.whl (wheel パッケージ形式)をダウンロードしたフォルダーのコマンドプロンプト(アドレスバーに "cmd" )から、
”pip install six-1.8.0-py2.py3-none-any.whl”
で無事インストール完了。
(あるいは、単に ”pip install six" でも良いかもしれない。)
※ https://pypi.python.org/pypi/six
4. ImportError
で要
求されたモジュール
【2度目】 ”ImportError: matplotlib requires dateutil”
5.Dateutil のインストール
Dateutil とは、”Extensions to the standard Python datetime module” である。
python-dateutil-2.2.tar.gz (圧縮ファイル形式)をダウンロードしてから高機能解凍ツール( Explzh
など)で解凍し、解凍先フォルダーのコマンドプロンプト(アドレス
バーに "cmd" )から、
”pip install python-dateutil”
で無事インストール完了。
※ https://pypi.python.org/pypi/python-dateutil
6. ImportError
で要
求されたモジュール
【3度目】 ”ImportError: matplotlib requires pyparsing”
7.Pyparsing のインストール
Pyparsing とは、”a library of classes that client code uses to construct
the grammar directly in Python code” である。
ダウンロードしてきた pyparsing-2.0.2.win32-py3.4.exe
(実行ファイル形式)をそのままダブルクリック実行で、無事インストール完了。
※ https://pypi.python.org/pypi/pyparsing
ここで再度、以下のプログラムリストを Run
した所、無事に実行された。結果的に、pip の使い方を学習することができた。
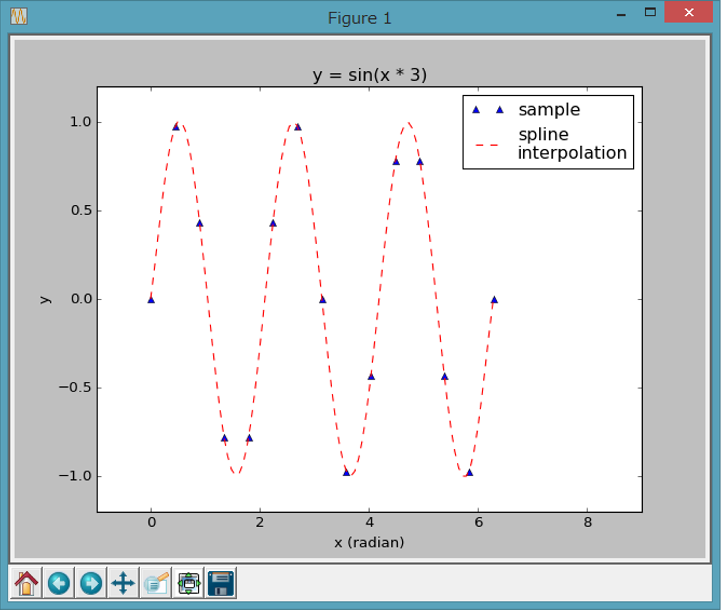
| #
scipy_interpolate_01.py # on Python 3.4.1, Oct. 2, 2014 # by Masao Sakuraba import math import numpy import scipy from scipy import interpolate import pylab def main(): x_sample = numpy.linspace(0, 2*math.pi, 15) y_sample = numpy.sin(x_sample * 3) # k : smoothness factor (k=1--5) spline = interpolate.InterpolatedUnivariateSpline(x_sample, y_sample, k=5) x_spline = numpy.linspace(0, 2*math.pi, 90) y_spline = spline(x_spline) # 'option' : color (r,g,b,c,m,y,k,w) & # line style (-,--,:,-.,.,o,^) pylab.plot(x_sample, y_sample, 'b^', label='sample') pylab.plot(x_spline, y_spline, 'r--', label='spline\ninterpolation') pylab.legend(loc='upper right') pylab.title('y = sin(x * 3)') pylab.xlabel('x (radian)') pylab.ylabel('y') pylab.xlim(-1, 9) pylab.ylim(-1.2, 1.2) pylab.show() if __name__ == '__main__': main() |
This home page is produced by KompoZer (free and open software).